354 Employees in 8 companies

At Ving, only 3 of their 34 employees reported that they did not have any pain in the upper body when using their traditional office chair. After 6 months using the Backapp products, this increased to 15!
Participants
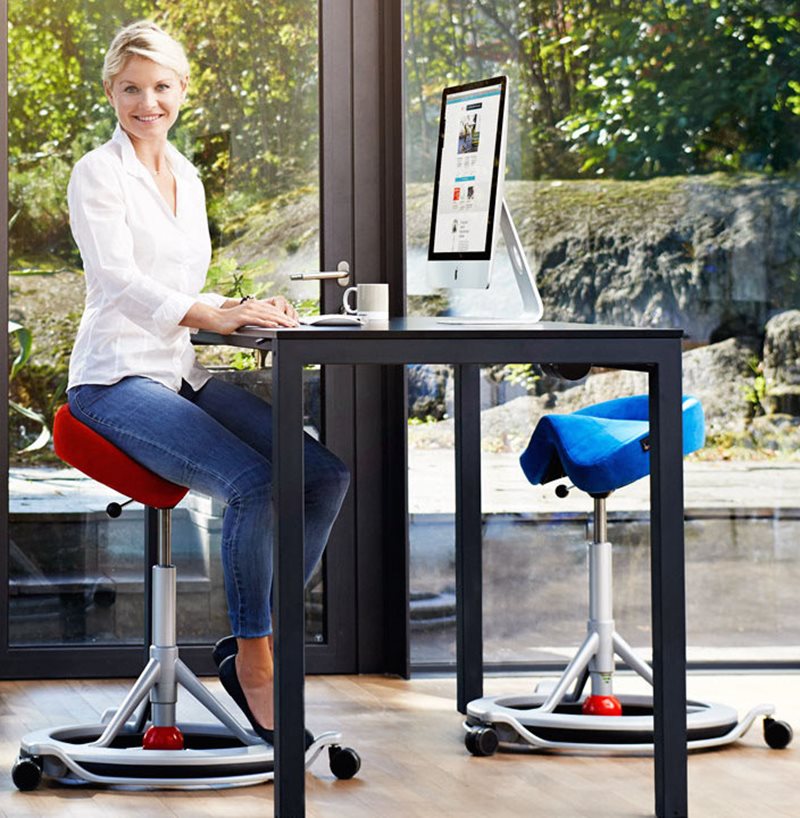
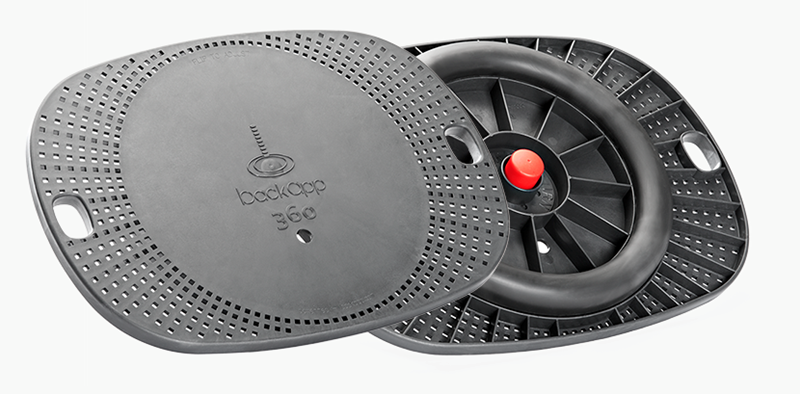
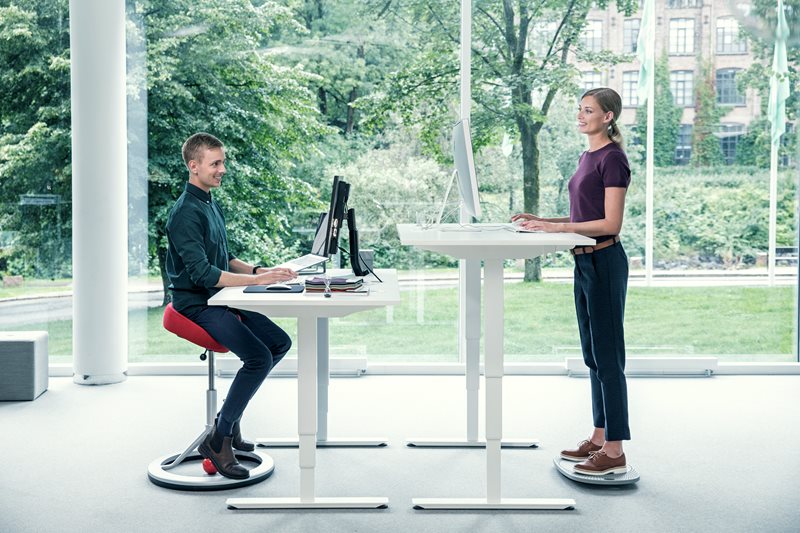
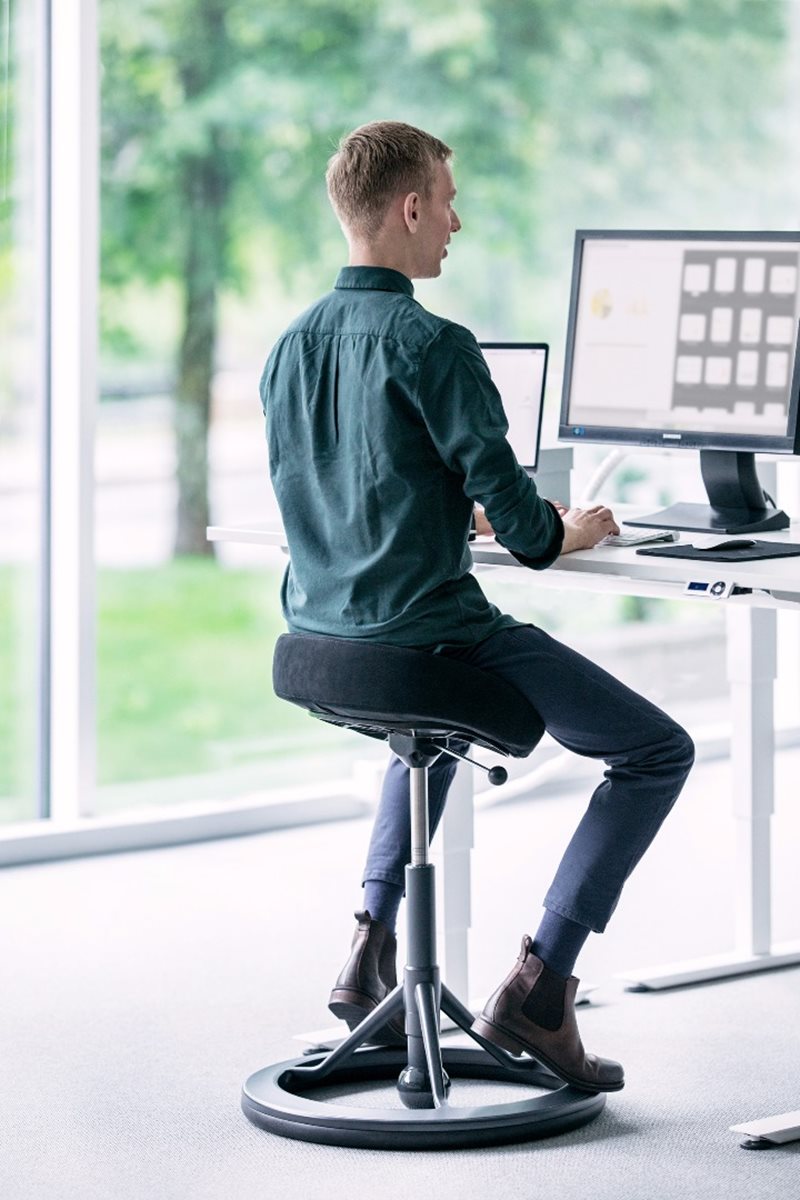
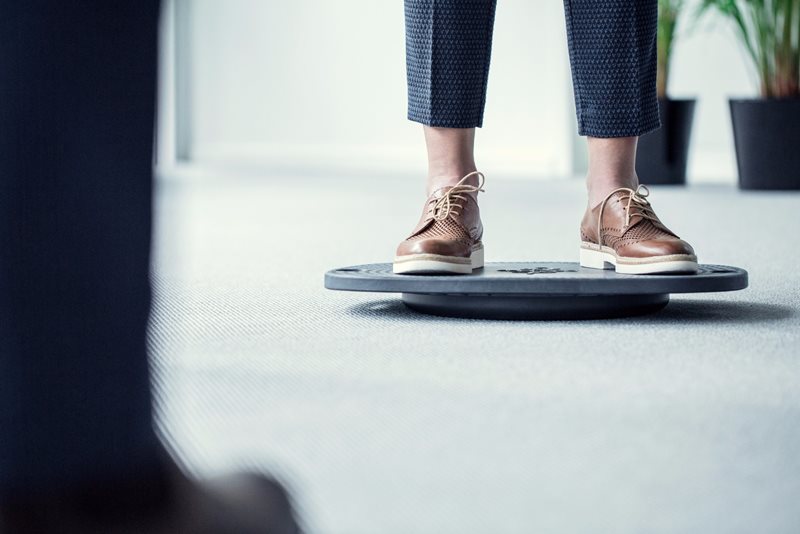
Ving Sweden is a travel agency. The 34 participants in the field trial works in a call center in Stockholm. 30 were women, 4 were men, and the average age was 41. They exchanged their traditional office chair with the Backapp chair and the Backapp 360 balance board.
Process
The participants were trained in how to use the Backapp chair and the 360 balance board They answered the questionnaire at the start of the trial, after 6 weeks, and after 6 months. The questionnaire was developed by an independent third party who received the completed forms and calculated and tabulated the statistical results.
LESS PAIN IN THE LUMBAR AREA
14 of the 34 participants reported pain in the lumbar area using their traditional office chair. After 6 months using the Backapp products, this decreased to 7! (see Table 1)
LESS PAIN IN THE NECK AND SHOULDER AREAS
Before the field trial started, 24 of 34 experienced pain in the neck and shoulder areas. After 6 months using the Backapp products, this was reduced to 10! (see Table 1)
LESS HEADACHES
12 of the 34 experienced headaches during and after work throughout the week. After 6 months, using the Backapp products, this was reduced to 6! (see table 1)
THE NUMBER OF PARTICIPANTS WITH PAIN FREE UPPER BODY INCREASED 5-FOLD
Only 3 of the 34 experienced no pain in the upper body using a traditional office chair. After 6 months using the Backapp products, this number increased to 15.
THE AVERAGE NUMBER OF AREAS WITH PAIN WAS REDUCED FROM 1.7 TO 0.85
Pain areas included the lumbar area, shoulders, neck, head, arms and hands. (Tabell 2)
THE EMPLOYEES HAD MORE ENERGY AFTER A FULL DAY AT THE OFFICE
14 of the 34 employees experienced lack of energy at the end of each workday using their traditional office chair. At the end of the 6 months, this was reduced to 6! (see Table 3)
Results
Table 1
Which of the following types of pains have you experienced during a normal work week. Number of participants.
|
|
Before the trial |
After 6 weeks |
After 6 months |
Change |
|
|
Number |
Number |
Number |
% |
|
Shoulder and neck pain/stiffness |
24 | 13 | 10 |
-58,3 |
|
Headaches during or after work |
12 |
7 |
6 |
-50,0 |
|
Lower back pain/stiffness |
14 | 11 | 7 | -50,0 |
|
None of the above (pain score = 0) |
3 |
10 |
15 |
5 times |
|
|
Table 2
Which of the following types of pains have you experienced during a normal work week. Multiple choice. Number of participants.
- Lower back pain/stiffness
- Shoulder and neck pain/stiffness
- Headaches during or after work
- Arm and/or hand pains
- None of the above
|
|
Before the trial |
After 6 weeks |
After 6 months |
|
Pain score = 0 |
3 | 9 | 15 |
|
Pain score = 1 |
12 | 15 | 11 |
|
Pain score = 2 |
12 | 8 | 6 |
|
Pain score = 3 |
6 | 2 | 2 |
|
Pain score = 4 |
1 | 0 | 0 |
|
Pain score = 5 |
0 | 0 | 0 |
|
Total |
34 | 34 | 34 |
|
Average pain score |
1,7 |
1,09 |
0,85 |
|
Change, % |
|
-36,1 |
-49,9 |
Table 3
How often do you feel tired at the end of a normal work day? Number of participant.
|
|
Before the trial |
After 6 weeks |
After 6 months |
|
Never |
2 |
4 |
4 |
|
Infrequently |
9 | 13 | 15 |
|
Every now and then |
9 | 9 | 9 |
|
Quite often |
11 | 6 | 4 |
|
Frequently/every day |
3 | 2 | 2 |
|
Total |
34 | 34 | 34 |
|
Quite often, every day |
14 | 8 | 6 |
|
% |
41,2 | 23,5 | 17,6 |
|
Change, % |
|
-42,9 |
-57,1 |

